Appearance
Student Analytics Dashboard
View detailed statistics about challenge attempts, success rates, earned badges, leadership, and more.
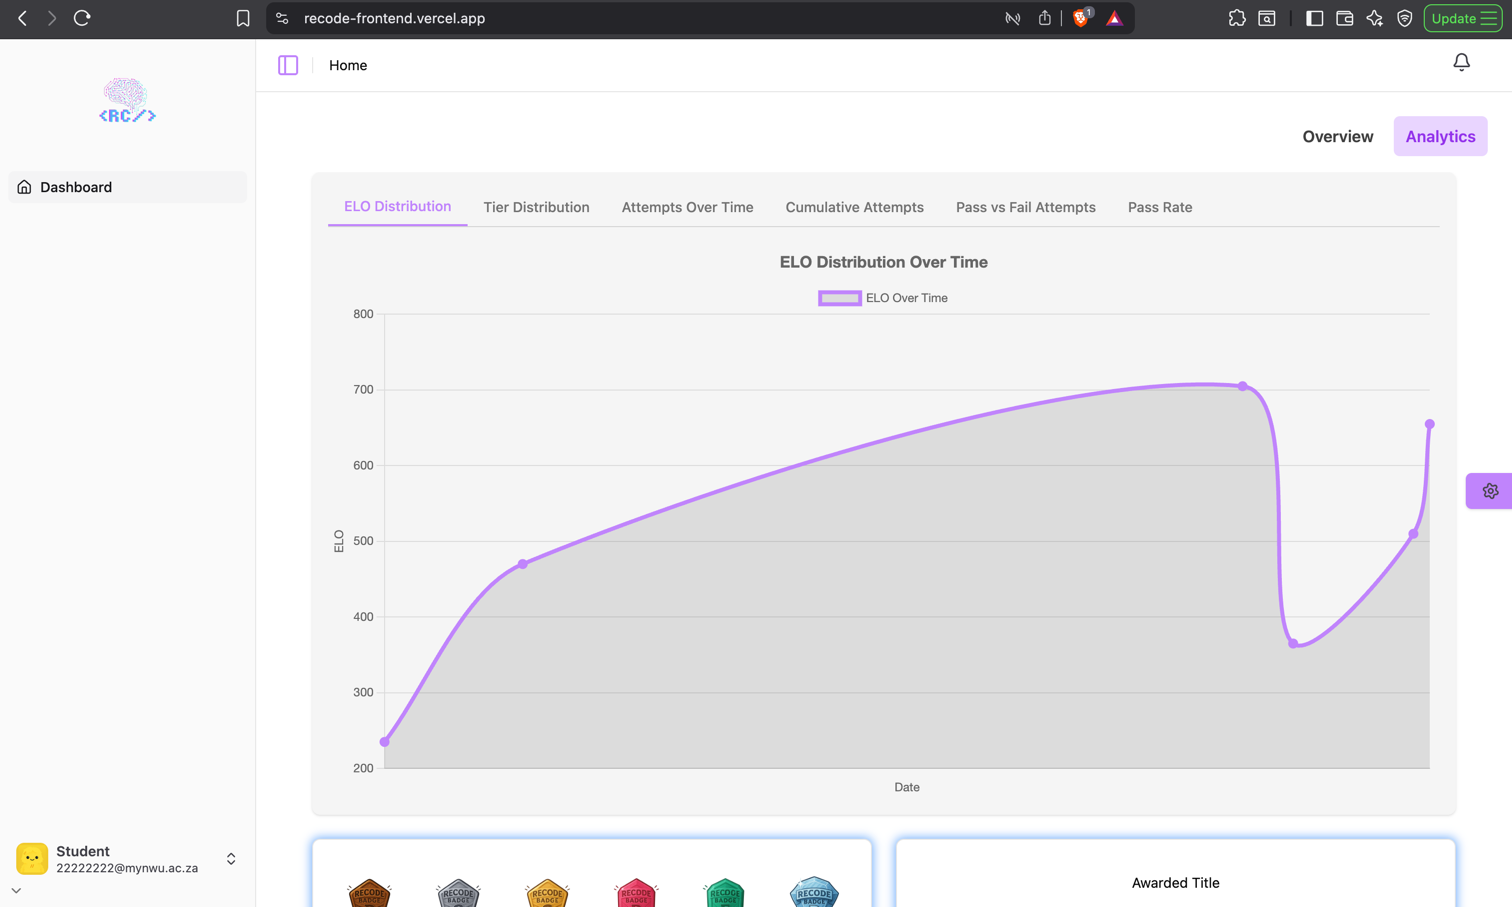
Performance Charts
The top section of the page contains interactive charts displayed under different tabs. Tabs allow switching between different types of analytics.
Available Tabs
| Column Name | Description |
|---|---|
| ELO Distribution | Student's ELO awarded over time |
| Tier Distribution | Quickly visualize the proportion of challenges attempted at each tier |
| Attempts Over Time | Shows progress/trends over time |
| Cumulative Attempts | See growth in difficulty tackled |
| Pass vs Fail Attempts | Shows a recent success/failure ratio |
| Pass Rate | Dashboard-style quick glance at overall success |
Badges and Awarded Title
The middle section displays badge counts and the student’s awarded title.
Badges Display
- Each badge type has an icon and a count of badges earned.
- Badges get awarded to the student when they complete a challenge.
Awarded Title
- Shows the title currently awarded to the student (e.g., “Master Coder”).
- Displayed next to the badge summary in a separate card.

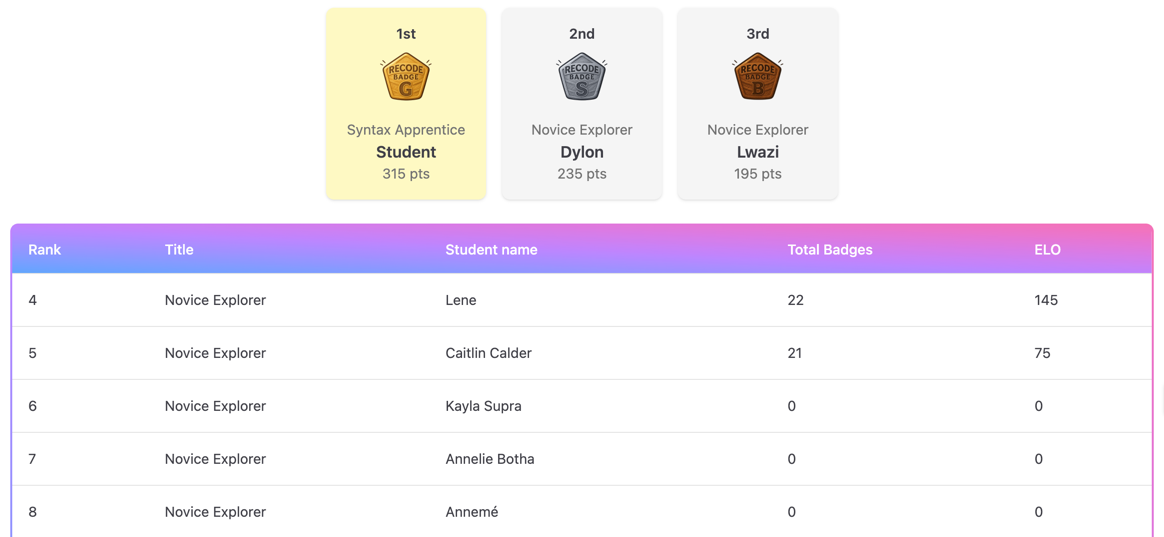
Podium
The podium highlights the top 3 students in the leaderboard.
Podium Cards
- Displays student rank, title, name, ELO points, and icon.
- Gold, silver, and bronze icons are used for 1st, 2nd, and 3rd place respectively.
- Cards adjust height dynamically to align visually.
Layout Notes
- Only shown if there are at least 3 students in the leaderboard.
- Remaining students are listed in the leaderboard table below.